Why does a city sometimes build more buses after a road becomes crowded, while another city decides to charge drivers to enter downtown? Both choices can sound reasonable. But how would we tell which one is likely to reduce traffic, who bears the cost, or whether either policy is worth paying for?
It is tempting to answer with a personal story: “I would take the bus if it were cheaper,” or “Drivers will always drive.” Those stories can suggest what to investigate, but neither settles the question. An economist tries to make the reasoning inspectable. What choices are people making? What is scarce? What are the alternatives? What does a model predict, and what evidence would change our minds?
That is the economic way of thinking. It is not a claim that every person is selfish, that money measures everything, or that one political answer follows automatically from a graph. It is a disciplined way to ask what people can do, what they give up, how incentives change their choices, and how those choices fit together.
A model is a map, not the territory
No useful map shows every tree, crack, and passing cloud. It leaves most things out so that one feature — the road from here to there — is easy to see. An economic model does the same thing with a situation. It keeps the features needed for a particular question and temporarily sets aside the rest.
Suppose we want to ask what happens to bus ridership when fares fall. We might represent the number of trips as depending on the fare, while holding wages, fuel prices, weather, routes, and population fixed. This is not a claim that those other things never matter. It is a way to ask one question at a time.
Economists often call this ceteris paribus — “other things being equal.” The phrase is a warning label attached to a prediction. If the fare falls and ridership rises, the model has described the effect of the fare change under the condition that the other relevant influences did not change in a way that explains the result. If fuel prices also doubled, we cannot casually attribute every new bus passenger to the fare cut.
Here is the basic cycle. Start with a question; choose assumptions that make it manageable; build a model; derive a prediction; compare that prediction with evidence; then keep, revise, or reject the model. The arrows matter: a model that never risks being checked against evidence is not doing much explanatory work.
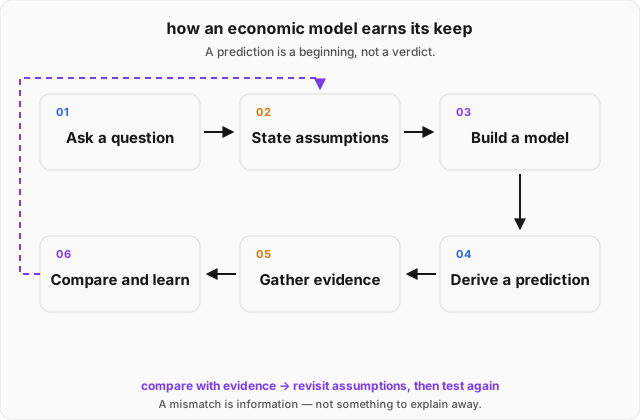
The simplest models can be drawn as a picture, written as a few sentences, or expressed as equations. Algebra is not automatically more truthful than a diagram. Its advantage is that it makes relationships and implications precise enough to check.
Choices have alternatives
There is one constraint hiding underneath the bus question: resources are limited. A city has a finite budget, buses take time to build, drivers have other work they could do, and streets cannot hold unlimited traffic. A choice uses something that could have been used elsewhere.
The opportunity cost of a choice is the best alternative that must be given up to make it. If a city spends a million dollars on late-night buses, that money cannot also fund a million dollars’ worth of another project. The opportunity cost is not necessarily “a million dollars” as a number; it is the value of the best forgone alternative.
This is why economists ask not only, “What does this option cost?” but also, “Compared with what?” A bus route may be worthwhile compared with doing nothing, but not compared with a different service that would help more people at the same cost. The next topic will make this trade-off visible using a production possibilities frontier.
Why the next unit matters
When someone says, “We should add one more bus,” they are proposing a change from the current situation. Economists examine that change at the margin: compare the additional benefit of one more unit with the additional cost of that same unit.
Write the marginal benefit of the th service hour as , and its marginal cost as . If the city’s stated objective is to maximize estimated net benefit, it should add another hour when
and stop before the next hour for which
This is not the same as saying “always do more when there is any benefit.” A benefit can be real and still be smaller than what must be given up to create it. Nor does the rule settle every public decision: who receives the benefits, who pays, and what the community values are important questions too. The model answers a conditional question about a chosen goal; it does not choose society’s goals for us.
A claim about the world, or a claim about what should happen?
Consider two sentences:
- “A lower bus fare will increase the number of rides, if routes and other conditions stay the same.”
- “The city should lower bus fares.”
The first is a positive claim: it describes or predicts what happens. We can look for evidence that supports or contradicts it. “Positive” here does not mean good, fair, or desirable.
The second is a normative claim: it says what ought to happen. It depends partly on evidence — perhaps lower fares would increase ridership — but also on values and priorities. Should the city prioritize access for low-income residents, reducing congestion, lowering emissions, or balancing its budget? Economic analysis can clarify the consequences and trade-offs. It cannot make those priorities disappear.
Keeping the two kinds of claim separate does not mean values are irrelevant to economics. It means we should be honest about where evidence ends and a judgment about what matters begins.
Evidence, prediction, and cause
Suppose a town adds streetlights in neighborhoods with many nighttime accidents. The next year, those neighborhoods still have more accidents than the rest of town. Does that prove the lights made the roads more dangerous? No. The town may have installed lights exactly where the risk was already highest.
This is a causation problem. The fact that two things move together — a correlation — does not by itself tell us which caused which, or whether a third factor affected both. To estimate the effect of the lights, we need a comparison: what happened in similar neighborhoods that did not receive them, over the same period?
The same caution applies to economic policies. If a city lowers bus fares and ridership rises, that is useful evidence, but we should ask what else changed. Did fuel become more expensive? Did a new route open? Did the population grow? A stronger comparison tries to isolate the policy’s effect rather than simply placing two numbers side by side.
Evidence does not turn every economic disagreement into a simple yes-or-no experiment. Sometimes the data are incomplete, effects take years, or the outcome we care about is difficult to measure. In those cases, we should say what the model predicts, what the evidence can establish, and what remains uncertain.
Worked example
A community center can add consecutive evening tutoring hours. Each hour costs 180 for the first hour, 90 for the third. If the center’s goal is to maximize estimated net benefit, how many hours should it add? What does this model leave out?
Step 1 — state what the model is deciding. We are comparing consecutive tutoring hours, and we assume the estimates are in the same dollar units. We also assume the center’s stated goal is to maximize total estimated benefit minus cost. Those are assumptions, not facts forced on every community center.
Step 2 — calculate each hour’s additional net benefit. For an hour with benefit and cost dollars, its marginal net benefit is
For the first hour:
The first hour adds an estimated $60 in net benefit. For the second:
The second hour also adds net benefit, though less than the first. For the third:
The third hour costs more than its estimated benefit.
Step 3 — choose the number of hours. Adding two hours produces total estimated net benefit of dollars. Adding the third reduces it to $60 dollars. Under the model’s objective and estimates, the center should add two hours.
Step 4 — inspect what the answer does not tell us. Are the benefit estimates reliable? Are the students who need tutoring able to attend? Could the same funds help more people through another program? Does the dollar estimate capture confidence, access, or fairness? The model has made one decision criterion precise; it has not answered every question a community might care about.
Where this leads
We have not yet built a full market model or explained how a price settles. We have built the habits needed to study one: name the constraint, identify the alternative, state the assumptions, reason about one more choice, and check predictions against evidence without confusing them with value judgments. The next topic, Opportunity Cost and the Production Possibilities Frontier, takes the first of those ideas — that limited resources force trade-offs — and derives exactly what those trade-offs look like.