Imagine you have exactly one Saturday before a big test in two different subjects. You can't conjure a second Saturday, and once an hour of it is spent on one subject, it's gone — it can't also be spent on the other. Almost everything worth having works this way at some scale: there's only so much time in a day, only so much land on a farm, only so many hands available to do work. Whatever gets produced or accomplished has to come out of that fixed, finite starting point. Economics begins right here. It treats this plain fact — that resources are limited while wants are not — not as a footnote, but as the one rule almost everything else in the subject is built on top of. There's even a name for it: scarcity.
Because resources are limited, choosing to have more of one thing usually means having less of something else. That "something else" you gave up is called the opportunity cost of your choice. So far, this is just common sense — everyone already knows you can't have your cake and eat it too. The genuinely interesting question, the one this topic is actually about, is what happens to that cost as you keep pushing further in one direction. The natural first guess is that the cost stays constant: if the tenth unit of one thing costs you one unit of the other, surely the first unit and the hundredth unit cost the same. That guess is wrong almost every time there's more than one way to get something done — more than one worker, more than one plot of land, more than one machine — and once you see exactly why, a two-good trade-off never looks quite so simple again.
Here's a small, concrete version of the problem. Two friends, Ann and Bob, are stranded on an island where the only two foods available are apples growing on trees and fish swimming in the lagoon. Ann is quick and light on her feet — she can strip an apple tree fast. Bob is a strong swimmer with sharp reflexes — he can spear several fish in the time it takes Ann to spear one. Between the two of them, they can produce some mix of apples and fish, in whatever combination they choose. The question this topic answers, using nothing more than arithmetic anyone can check by hand, is: exactly how many fish do they have to give up for each additional apple they decide to grow — and does that number stay the same, or does it quietly get worse the harder they push?
It's a tiny toy economy on purpose — two people, two goods — precisely so every step of the reasoning can be checked directly, with no hidden assumptions. But nothing about the logic depends on there being only two people. The same reasoning, scaled up to millions of workers and thousands of goods, is exactly how real economists explain the shape of a real country's trade-offs, whether that's guns versus butter or wheat versus steel.
What a "frontier" actually means here
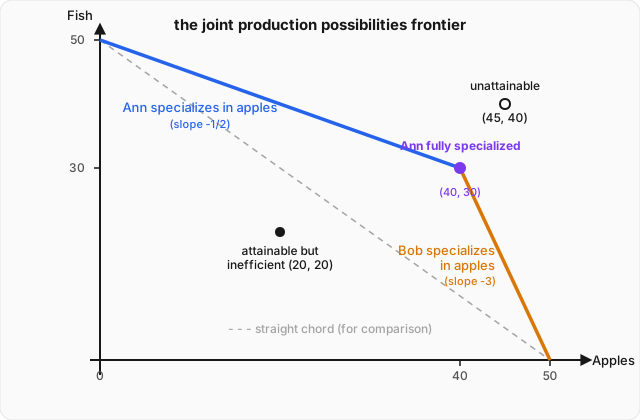
Before touching any numbers, it helps to know what the destination looks like. If you plotted every combination of apples and fish that Ann and Bob could possibly produce together, using their time as well as possible, you'd get a boundary line. Economists call it the production possibilities frontier, or PPF for short — "production possibilities" because it's every combination they're capable of producing, and "frontier" because it's the outer edge of what's possible, not something safely inside it.
Three kinds of points matter here, and it's worth naming them before deriving anything:
- Points on the boundary are attainable and use every available hour efficiently — no time wasted, no resource sitting idle.
- Points inside the boundary are attainable but wasteful — Ann and Bob could rearrange their time and end up with more of at least one good, without giving up any of the other.
- Points outside the boundary are simply impossible with the time they currently have — no clever rearranging of hours gets them there.
The genuinely interesting question — the one that took real work to answer intuitively above — is the exact shape of that boundary line. Is it straight? Curved? And if curved, which way, and why? The rest of this topic derives that shape honestly, step by step, using Ann and Bob as the worked example.
Two people, two goods, and two different talents
To make this precise, give each person a fixed, limited resource: their own time. Say each of them has hours available. Each hour, whichever way they choose to spend it, converts into either apples or fish at some fixed personal rate. Think of that rate as answering a simple question: if you handed this person one completely free hour and told them to spend it only picking apples, how many would they come back with?
For Ann, the answer is 4 apples per hour, or 2 fish per hour if she spends the hour fishing instead. For Bob, the answer is 1 apple per hour, or 3 fish per hour fishing. In plain words: Ann is the better apple-picker of the two, by a wide margin, while Bob is the better fisherman, by an even wider one. Neither of these numbers is an assumption pulled out of thin air for convenience — they're exactly the kind of thing you could measure by watching each person work for an hour.
Now turn "Ann has 10 hours to split between apples and fish" into algebra. Let be the hours she spends on apples and the hours she spends on fish, so . Her outputs are then apples and fish. Solving each for time and substituting into the time constraint:
In plain words, this equation is just Ann's own personal trade-off menu: it tells you, for any number of apples she decides to make, exactly how much fish she has left time for. It's a straight line with slope , and that slope is the answer to the opening question, applied to Ann alone: to get one more apple, Ann always gives up exactly a fish, because her hour is worth 4 apples or 2 fish, and . That number, , is Ann's personal opportunity cost of an apple, measured in fish.
Running the identical algebra for Bob, whose hour is worth 1 apple or 3 fish, with , , :
Bob's opportunity cost of an apple is 3 fish — six times steeper than Ann's. In plain words, apples are cheap for Ann and expensive for Bob, while fish are the reverse. This gap between them — Ann being the cheap apple-producer, Bob being the cheap fish-producer — is what economists call comparative advantage, and it's the entire engine driving everything that follows.
Efficient allocation: why comparative advantage decides the order
If Ann and Bob want to produce apples together, common sense already suggests an answer: let Ann, the cheap apple-producer, make apples first, and only ask Bob to pitch in once Ann is already doing as much apple-picking as she can. That's exactly right — but "common sense suggests it" isn't the same as "it's proven," and this site's whole approach is to actually prove things rather than just find them plausible. So here's the proof.
Suppose, for the sake of contradiction, that in some allocation Bob spends an hour on apples while Ann simultaneously spends an hour on fish. Swap them: move one hour of Bob's time from apples to fish, and one hour of Ann's time from fish to apples. The changes in total output are
Both outputs went up — apples by 3, fish by 1 — using exactly the same total labor as before. In plain words, the swap made everyone better off with zero extra effort, which means the allocation it started from could not have been on the frontier at all: it was simply wasteful, a point sitting inside the boundary rather than on it. Since this argument works for any allocation with Bob on apples while Ann still has fish-hours left, an efficient allocation can never look like that. Apples have to be produced by the cheapest available source — Ann — before the expensive one — Bob — is asked to help at all.
The shape of the frontier: why the trade-off gets worse
With the allocation order settled, build the joint frontier in two stages, matching the two people.
Stage 1, while only Ann makes apples (). Ann puts hours into apples and the remaining hours into fish, producing fish. Bob, untouched so far, spends all 10 hours fishing: fish. Adding the two together:
Put plainly: as long as Bob is left entirely to fishing, every extra apple Ann makes costs exactly a fish — her own personal rate, unchanged, because nothing about Bob's situation has changed yet.
Stage 2, once Ann is fully specialized and Bob has to help (). Ann now contributes her maximum — 40 apples, 0 fish. Any apples beyond 40 have to come from Bob, who spends hours on apples, leaving hours for fish:
Check that the two pieces meet without a gap: Stage 1 gives ; Stage 2 gives . They agree, as they must — the frontier has no jump, only a change in steepness.
And that change in steepness is the whole point. On Stage 1 the slope is — Ann's rate. On Stage 2 it's — Bob's rate. In plain words, the cost of an apple, measured in fish given up, jumped from half a fish to three fish the instant the cheap producer ran out and the expensive one had to be called in. More generally, whichever resource is currently "at the margin" — the one actually being reallocated right now — sets the local slope: if that resource makes apples or fish per hour, moving one hour from fish to apples changes output by , so locally
This ratio is called the marginal rate of transformation, and in plain words it's nothing more than whichever resource is currently doing the reallocating, valued in its own opportunity cost. It rises here precisely because the cheap resource runs out and production is forced onto a progressively more expensive one — this is the actual mechanism behind "increasing opportunity cost," not just a rule to memorize.
One more check confirms this really is a bowed-out (concave) curve, not just a bent one. Compare the true frontier to the straight chord connecting its two endpoints, and : that chord is . At , the chord predicts , but the actual frontier (Stage 1) gives — noticeably more fish than the straight line would allow. In plain words, the real frontier sits above the straight-line shortcut between its endpoints, which is exactly what "bowed outward from the origin," or concave, means. With only two people the bow shows up as a single visible kink; with many people or many plots of land, each with slightly different talents, the same greedy logic produces many small kinks that blend together into the smooth, continuously steepening curve you'll see drawn everywhere from here on.
Worked example
Ann and Bob want to produce exactly 45 apples, allocating their time efficiently. (a) How many fish can they produce at the same time? (b) What is the marginal opportunity cost, in fish, of the 45th apple?
Step 1 — locate the target on the frontier. Since , this output level is past the kink: Ann is already fully specialized in apples (40 apples, 0 fish), and Bob is supplying the remaining apples.
Step 2 — solve for Bob's allocation. Bob makes 1 apple per hour, so producing 5 apples takes
That leaves Bob hours for fish, producing
Step 3 — total fish. Ann contributes 0 fish, since she's fully specialized in apples, so
Check against the closed-form Stage 2 equation: . Matches.
Step 4 — marginal opportunity cost. At , we're on Stage 2, where , so
The 45th apple costs 3 fish — Bob's rate, since Bob is the one currently doing the producing at this output level. A direct sanity check confirms it: making a 46th apple would take one more Bob-hour shifted from fish to apples, adding 1 apple and removing 3 fish — exactly the predicted rate.
Where this leads
The frontier just derived answers a purely technological question: given fixed resources, what combinations of apples and fish can this little economy possibly produce, and how much worse does the trade-off get as one good is pushed further? It says nothing about which single point on that frontier Ann and Bob actually end up choosing — why they'd settle on, say, 30 apples and 40 fish rather than any of the other combinations the frontier allows. That choice isn't decided by technology at all. It's decided by something that hasn't entered the picture yet: how much each of them wants apples versus fish, and, in a larger economy, how the independent wants of many buyers and sellers, coordinated by nothing but a price, settle on one exact point among all the ones a frontier like this one makes possible. That mechanism is the subject of the next topic: Interdependence and the Gains from Trade.