Every few months, a headline announces that a country’s GDP grew. The number sounds like a verdict: the country is doing better. But what exactly grew? The money changing hands? The amount of useful things produced? The well-being of an ordinary household? Those are not the same question, and one statistic cannot answer all of them at once.
GDP is a measurement with a precise job. It estimates the market value of final goods and services produced within an economy during a particular period. To understand what that sentence includes — and what it leaves out — we can follow one cup of coffee from a farm to a café, then count the same production from three different directions.
What the letters actually mean
Gross domestic product is easier to understand if we take the words one at a time.
- Product means goods and services produced during a period — not the resale of something made years ago.
- Domestic means production located inside the economy’s borders, regardless of whether the producer is locally or foreign-owned.
- Gross means depreciation of buildings and machinery has not yet been subtracted. A “net” measure would deduct the value of capital used up in production.
So GDP is not a country’s bank balance, its wealth, its government revenue, or the amount of cash in circulation. It is a flow of production measured over a period — a quarter or a year, for example. A factory built in the past is part of the country’s stock of capital; the machinery it produces this year is part of this year’s production.
The word final prevents us from counting the same production more than once. Coffee beans may be sold by a farmer, then by a roaster, and finally as a cup in a café. If we add all three sales, we count the beans repeatedly. GDP instead counts the final cup, or adds the extra value created at each step. These two methods must agree.
One cup, three measures of production
Suppose a farmer sells beans for $2. A roaster turns them into roasted beans and sells those for $5. A café uses the roasted beans, its equipment, and a barista’s work to sell a cup for $9.
The value added at each stage is the sale value minus the value of intermediate inputs purchased from the previous stage:
Adding the contributions gives
which equals the price of the final cup. The beans and roasted beans were not ignored; their value appears in the stages that produced them. We simply avoid adding the same value again when it is embodied in the next sale.
Now look at the same $9 from the buyer’s side. The customer’s final purchase is $9 of consumption expenditure. From the people’s side, that $9 becomes income generated by producing the cup — wages, rent, profit, and other production-related income. In a complete set of national accounts, the production, expenditure, and income approaches are three views of the same activity.
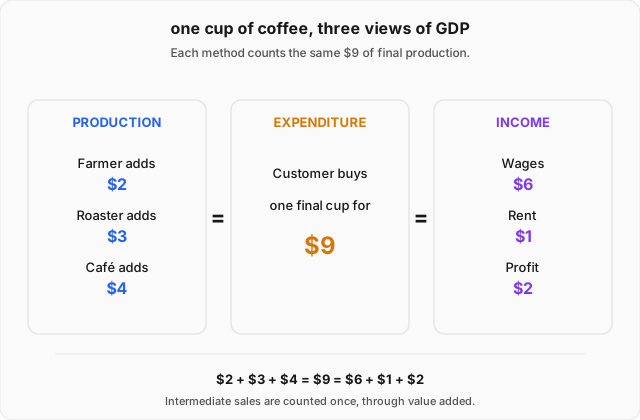
This equality is an accounting identity, not a claim that the three quantities are always measured perfectly in practice. Statistical agencies gather information from different surveys and records, so preliminary estimates can differ and later be revised. But the concepts are designed to fit together.
Counting purchases without counting imports as domestic production
For the expenditure view, divide final spending into four familiar parts:
Here is GDP, is household consumption, is investment in newly produced capital and inventories, is government consumption and investment in goods and services, is exports, and is imports.
The most counterintuitive part is the minus sign on imports. Imagine a household buys a phone made abroad. That phone may appear in measured consumption, , because the household bought it. But it was not produced domestically. Subtracting imports removes that foreign production from the domestic total. The same logic applies when a firm buys an imported machine or a government buys an imported medical supply.
Exports go the other way: they were produced at home, but purchased by people or firms abroad. They belong in domestic production, so they are added.
Two other terms are easy to misread:
- Investment in GDP does not mean buying stocks or bonds. It means newly produced capital goods — equipment, structures, housing, and additions to inventories — that help provide goods and services in the future.
- Government purchases include goods and services the government buys or produces. A transfer payment, such as a pension or unemployment benefit, is not itself payment for newly produced output, so it is not counted as government production when the transfer is made. What recipients later buy with that income can be counted as consumption.
The categories can look less tidy in real statistical accounts, but the accounting question remains the same: where was the production, and who was the final user?
GDP in dollars: output or prices?
Suppose a country produces more bread this year, but bread also costs more. Its total sales value will rise for two reasons: more loaves were made, and each loaf has a higher price. The total measured in current prices is nominal GDP. It combines changes in quantities and prices.
To ask whether the economy actually produced more, we need to separate those effects. Real GDP adjusts output for price changes. In a small teaching example, we can hold prices fixed at their base-year values and compare quantities.
Say the base-year economy produces 100 loaves at $2 each and 20 haircuts at $10 each. Its base-year GDP is
In the next year, production rises to 110 loaves and 22 haircuts. Prices rise too: bread costs $3 and a haircut costs $12. Nominal GDP is
That is 48.5% above the base-year total. But now value the new quantities at the old prices:
Real output grew by 10% in this example:
The remaining rise in nominal GDP reflects higher prices, not extra quantities. This is why a headline that says “GDP rose 48.5%” would be badly misleading if the question were how much more the country produced.
For a compact summary, statisticians often calculate the GDP price deflator:
With the simple fixed-base figures above, the next-year deflator is . The base year is 100, so the overall price level in this tiny example is 35% higher than in the base year. That is not the same as saying prices rose 35% in that single year unless the base year is exactly the previous year.
Fixed base-year prices keep the arithmetic visible for learning. In practice, many statistical agencies use chain-type quantity measures that update the weights over time, so the official real-GDP calculation is more sophisticated than simply pricing every year forever at one old year’s prices. The international statistical standard for national accounts is also revised over time; countries adopt updated standards on different schedules. The United Nations describes the current System of National Accounts. When comparing published figures, check the statistical agency’s definitions, price basis, and revision notes.
GDP, income, and the word “national”
GDP tells us where production happens. A foreign-owned factory operating inside a country contributes to that country’s GDP because the production takes place there. But some of the income generated may later flow to owners who live elsewhere.
Gross national income (GNI) asks a related question: how much income is earned by the economy’s resident households and institutions, including income they receive from abroad, and excluding income generated at home but paid to nonresidents? In simplified form:
“Resident” is an economic-residence concept, not simply a person’s passport. The distinction matters for countries with substantial cross-border investment, workers, or income flows. GDP measures domestic production; GNI measures income accruing to residents. Neither one alone tells us how that income is distributed among them.
What GDP can tell us — and what it cannot
GDP is useful because it gives a consistent framework for tracking market production over time and comparing its components. It helps us ask whether total output is growing, which sectors contribute to production, and how spending is divided among households, businesses, government, and foreign buyers.
But GDP was not designed to be a complete score for how well people are doing. It does not tell us:
- whether income gains went mainly to a small group or were widely shared;
- how much unpaid care, cooking, or household work people perform;
- whether people have more free time or feel safer and healthier;
- whether production caused pollution or used up natural resources;
- whether goods and services are distributed according to people’s needs.
GDP per person divides total GDP by population, which makes it more useful than total GDP for some comparisons. But it is still an average. Two countries can have identical GDP per person while one has a much more unequal distribution. An increase in real GDP per person can be evidence of greater average production capacity without proving that every household is better off.
These are not reasons to throw GDP away. They are reasons to use the measure for the question it was built to answer — production — and pair it with other measures when asking about income distribution, health, education, poverty, or environmental conditions. The United Nations’ national accounts framework is an internationally agreed measurement system, not a promise that one number captures every dimension of an economy or of human well-being.
Worked example
An economy reports household consumption of $620, business investment of $180, government purchases of $200, exports of $90, and imports of $90. The consumption, investment, and government totals include imported goods worth $40, $30, and $20 respectively. What is GDP, and why are imports subtracted?
Step 1 — write the expenditure identity.
Substitute the reported totals:
GDP is $1,000.
Step 2 — trace the imported goods. The $620 of consumption already includes $40 of imported goods. Investment includes $30 of imported machines, and government purchases include $20 of imported supplies. Together those imports total $90. They are part of the spending categories but were produced abroad, so they must not remain in domestic production.
Step 3 — see why the subtraction works. Add the first four spending categories before subtracting imports:
That total includes $90 of foreign-produced goods. Subtracting $90 leaves $1,000 of spending on domestically produced final output. Imports are not “bad” and the minus sign does not mean importing reduces production by itself; it is an accounting correction that keeps GDP domestic.
Where this leads
GDP gives us a way to measure the economy’s production, but the difference between nominal and real GDP has already opened another question: how do we measure changing prices? The next macroeconomic step is to study inflation and price indexes, and then to ask what GDP leaves out when the question is not only “How much was produced?” but “How are people doing?”