Imagine two towns with the same number of people working. In one, nearly everyone who wants a job is searching. In the other, many people have given up looking because they believe no jobs are available. Could the second town report a lower unemployment rate? It can. That sounds paradoxical until we ask the most important question in this lesson: who is counted in the labor force?
GDP tells us about production, and price indexes tell us how measured prices change. Neither tells us directly how many people who want work can find it. To study that, statistical agencies sort people into categories—and the boundary between “unemployed” and “not in the labor force” changes the headline number.
Three categories, not two
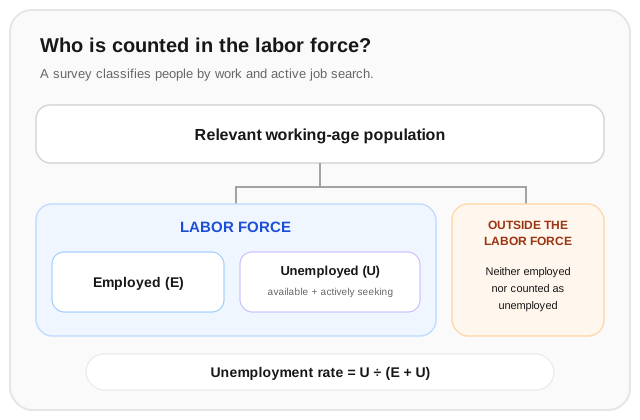
For a simplified labor-market snapshot, divide the relevant working-age population into three groups:
- Employed: people who did paid work or worked in a business during the reference period, plus some people temporarily away from a job.
- Unemployed: people without work who meet the survey’s availability and active-search criteria.
- Not in the labor force: people who are neither employed nor classified as unemployed under those rules.
The precise age range, treatment of temporary absence, and definition of active search depend on the country’s statistical system. The categories above express the common basic logic, not every operational detail of every national survey. A person who wants a job but has not recently searched may be outside the labor force in the headline measure; a student or retiree may also be outside it for entirely different reasons.
The labor force is the employed and unemployed together:
People outside the labor force are not necessarily idle or unimportant. They may be studying, caring for family, retired, unable to work, or simply not seeking work right now. “Outside the labor force” is a statistical category, not a judgment about someone’s contribution or effort.
What the unemployment rate measures
The headline unemployment rate is the number of unemployed people as a share of the labor force:
If 900 people are employed and 100 are unemployed and actively seeking work, the labor force is 1,000 and the unemployment rate is 10%. The 200 people outside the labor force are not added to the denominator.
That choice is purposeful: the rate asks what share of the labor force is unemployed according to the survey’s definition. But it also means that the rate is not “the share of all adults without jobs,” nor is it “the share of people who would accept a job if one appeared.” Those are different questions and require different measures.
Two companion measures help fill in the picture:
The first asks what share of the relevant population is working or actively looking. The second asks what share is employed. A country can have a modest unemployment rate but low participation, or a higher unemployment rate alongside strong participation. The three numbers answer related but distinct questions.
How the rate can fall without more people working
Return to the two towns. Suppose the labor force initially has 900 employed people and 100 unemployed job seekers:
Now imagine 20 job seekers stop actively searching and are reclassified as outside the labor force. No one has found a job; employment is still 900. The measured unemployment rate becomes
The rate fell from 10% to about 8.2%, even though the number employed did not rise. At the same time, participation fell from to , assuming the relevant working-age population stayed at 1,200. Looking at participation makes the change harder to misread.
The reverse can happen too. When job prospects improve, people who had stopped searching may begin looking again. If they do not immediately find work, they enter the labor force as unemployed and the unemployment rate can temporarily rise—even while the labor market is drawing more people back into active search. The rate is a ratio, so both its numerator and denominator matter.
The headline measure leaves out some hardship
The standard measure is useful and comparable over time within a consistent survey. It is not a complete census of unmet demand for work. For example:
- A person working a few hours who wants a full-time job is generally counted as employed, though underemployed.
- Someone who wants work but has not searched recently may be outside the labor force rather than unemployed.
- A person may be searching for a job that matches their skills while currently doing work below their training or experience.
- The rate says nothing by itself about wages, job security, working conditions, or whether a person can afford basic needs.
Statistical agencies often publish broader measures that include some discouraged or underemployed workers, but definitions differ. When comparing countries, it is important to check survey rules, population coverage, and whether the figures are seasonally adjusted. A number can be precisely calculated and still answer a narrower question than the headline suggests.
Different paths into unemployment
Economists often distinguish several reasons unemployment occurs. These categories help organize mechanisms; they are not always clean boxes for each individual.
- Frictional unemployment arises as people move between jobs, enter the workforce, or search for a position that fits. Even a healthy labor market takes time to match workers and employers.
- Structural unemployment reflects a mismatch between the workers available and the jobs employers need filled—perhaps because skills, location, technology, or institutions do not line up.
- Cyclical unemployment is associated with downturns in overall economic activity, when firms sell less and reduce hiring or employment.
These can overlap. A worker laid off during a recession may also need new skills or a different location to find the next job. The categories are useful because different causes suggest different responses; they do not guarantee a simple policy solution.
Worked example
A town has 900 employed residents, 100 unemployed residents who are available and actively seeking work, and 200 residents outside the labor force. Then 20 unemployed residents stop searching and are counted outside the labor force. No one gets or loses a job, and the working-age population stays at 1,200. Calculate the unemployment rate and participation rate before and after. What changed—and what did not?
Step 1 — calculate the initial labor force and rates.
Step 2 — update the classifications. Employment remains 900. The 20 people who stopped searching are no longer counted as unemployed, so unemployment becomes 80. The labor force is now ; the remaining 220 residents are outside it.
Step 3 — recalculate.
The headline unemployment rate fell, and participation fell too. Employment did not increase. The change came from people moving between statistical categories, not from new jobs. That is why interpreting the unemployment rate alongside participation and the employment-to-population ratio gives a more complete view.
Where this leads
GDP, price indexes, and labor-market measures each describe a different part of the economy: production, prices, and access to work. Unemployment statistics also show why a single national average can hide different experiences across people and places. From here, we can connect these measurements to the business cycle—why output, hiring, and prices sometimes rise together and sometimes weaken at the same time.