Suppose your usual grocery basket cost 100 units of money last year and 108 this year. Did the price level rise by 8%? Maybe—but first we need to know what is in the basket, whether the goods are comparable, and whether we are talking about one household or the economy as a whole. “Prices went up” sounds like an observation. Inflation is a measurement built from many observations, combined according to a rule.
GDP taught us to separate the value of output into quantities and prices. Inflation turns our attention toward the price part: how do we summarize many changing prices in one number, and what does that number actually tell us?
A price is not the price level
The price of a particular good can rise because it becomes scarcer, more desirable, more costly to produce, or simply different in quality. That change matters to the people who buy or sell that good. But it is not, by itself, inflation.
An economy contains millions of prices. A price index compresses a selected set of them into a summary number. An index is not a pile of dollars, and the number 120 does not mean goods cost 120 dollars. It is a scale: if the index is 100 in a chosen base period and 120 now, the measured price level for that index is 20% above the base-period level.
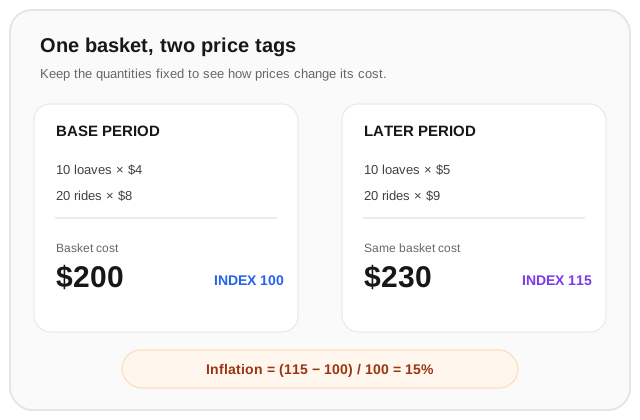
To make the idea concrete, imagine a very small economy in which households buy only bread and bus rides. A statistician can choose a representative basket—say, 10 loaves and 20 rides—and ask how much that same basket would cost at prices in different years. Holding the quantities fixed helps separate the price change from a change in what people buy.
Building a consumer price index
A consumer price index (CPI) tracks the prices of goods and services purchased by consumers. The exact basket, sample, quality adjustments, and calculation methods depend on the statistical agency. For a simple fixed basket, the calculation is:
If the base-period basket costs 200, the base-period index is 100 by construction. If that same basket costs 230 later, then
The index is 15% above its base-period value. To measure inflation between any two periods, calculate the percentage change in the index, not the difference in index points:
If CPI rises from 120 to 126, inflation over that interval is
not 6%. Six is the increase in index points; five percent is the proportional increase relative to the starting index.
The basket makes the measure possible, but it also raises a question: do people keep buying the same quantities when relative prices change? In reality, they substitute. If beef becomes more expensive relative to chicken, some households buy less beef. A strictly fixed basket may therefore overstate the cost increase needed to maintain a similar standard of consumption. Statistical agencies use more elaborate methods and update weights to address changing spending patterns, but no single index can perfectly represent every household’s experience.
CPI and the GDP deflator answer different questions
In the previous lesson, we met the GDP price deflator:
It measures prices associated with domestically produced final output. A CPI instead follows a consumer basket. The distinction matters:
- The CPI can include imported consumer goods, because households buy them.
- The GDP deflator excludes imports, because imported goods were not produced domestically.
- The GDP deflator includes domestically produced investment and government output, even when households do not buy those items directly.
- A consumer price index is weighted toward consumer spending; the GDP deflator’s weights reflect the composition of domestic production and change with it.
So the two inflation rates can differ. There is no contradiction: the measures have different coverage and weights. To study the cost of a consumer basket, CPI-like measures are relevant. To separate nominal GDP growth into domestic price and real-output changes, the GDP deflator is relevant.
Inflation, disinflation, and deflation
Inflation is a rate of change in a price index. It is not the price index itself. This distinction lets us tell apart three situations:
- Inflation: the overall measured price level is rising; the inflation rate is positive.
- Disinflation: the price level is still rising, but the inflation rate is falling.
- Deflation: the overall price level is falling; the inflation rate is negative.
If inflation slows from 8% to 3%, prices have not generally returned to where they were. They are still rising, just more slowly. For the price level to fall, the rate must go below zero. Confusing disinflation with deflation is like confusing a car that is slowing down with one that is moving backward.
An index is also an average over a chosen group. A household that spends a large share of its budget on rent may experience a different change in its personal cost of living than a household that owns its home. A national CPI can be carefully constructed and still fail to match any one person’s exact basket.
What inflation does to money amounts
If a paycheck rises by 4% while the relevant price index rises by 6%, the paycheck buys less of the indexed basket than before. A quick approximation subtracts the inflation rate from nominal income growth:
Here the approximation is . The exact calculation compares the nominal-income index with the price index:
The paycheck grew in money terms, but purchasing power fell by about 1.9% using that price measure. The result depends on which index best matches the goods and services the person buys.
This is why contracts and comparisons often need an inflation adjustment. A nominal amount is stated in current money. A real amount has been adjusted for a price index so that purchasing power across periods can be compared. The choice of index matters: one index may be suitable for consumer prices, another for output prices, and neither perfectly captures every cost someone faces.
Worked example
A household’s fixed reference basket contains 10 loaves of bread and 20 bus rides. In the base year, bread costs $4 per loaf and a ride costs $8. One year later, bread costs $5 and a ride costs $9. Calculate the basket’s cost in each year, the CPI in the second year if the base-year CPI is 100, and the inflation rate.
Step 1 — price the basket in the base year.
The base-year basket costs $200.
Step 2 — price the same quantities one year later.
Keeping quantities fixed isolates the change in the prices used for this example. The basket costs $230.
Step 3 — calculate the CPI. Since the base-year cost is 200 and its index is 100,
Step 4 — calculate inflation from the base year.
The measured inflation rate for this one-year interval is 15%. It does not mean each item’s price rose by 15%: bread rose by 25%, while bus rides rose by 12.5%. The basket’s 15% change reflects its quantities and starting costs.
Where this leads
GDP separates the value of production from changing prices; a price index gives us a systematic way to summarize those price changes. But an inflation number still leaves an economic question open: how do wages, spending, production, and employment respond when prices and expectations change? The next macroeconomic topics can build on these measurements to study the labor market and the broader fluctuations in economic activity.