A firm wants to build a new workshop. It needs money now for materials and equipment, while the extra output may arrive years later. Somewhere, someone must be willing to postpone spending, lend, or accept a financial claim in exchange for purchasing power today. But does every machine have to be financed by a particular household’s deposit? And if saving and investment are so different at the level of individual decisions, why do macroeconomists say they are linked?
The answer has two parts. National accounting tells us how total saving and investment fit together after all transactions are recorded. A model of the loanable-funds market then offers one way to reason about how households, firms, governments, and financial institutions make plans before the outcome is known. The model is useful—but it is not a literal picture of every bank loan.
Two meanings of “investment”
In everyday conversation, an investment might be a stock, a bond, or a house bought because its price may rise. In GDP accounting, investment has a narrower meaning: spending on newly produced capital goods, new residential structures, and changes in business inventories. A firm buying a newly made machine is investing in the national-accounts sense. A person buying an existing share from another investor is not directly creating current production.
The distinction matters because finance and production are connected without being the same event. A firm can issue a bond to raise funds, then use the proceeds to order equipment. The bond sale is a financial transaction; the equipment is a newly produced capital good. Finance can help move purchasing power toward production, but counting both transactions as current output would count the same activity incorrectly.
Saving is also a flow, not a pile of cash. For a household, it is the part of income not spent on consumption during a period. At the national level, we add the saving of households and firms to the public sector’s saving, using consistent accounting definitions. The assets people own—deposits, bonds, shares, and machines—are stocks measured at a point in time. Saving and investment are flows measured over a period.
The accounting link in a closed economy
Begin with the expenditure identity for a simplified economy with no trade:
where is national income and output, is private consumption, is investment in newly produced capital and inventories, and is government purchases. Rearranging gives
The left side is national saving, : the output not used for private consumption or government purchases. Therefore,
This equality is an accounting identity for the closed economy after production and spending have been recorded. It does not say that every household deliberately chooses to save exactly the amount firms planned to invest. If firms produce goods that are not sold as expected, the unsold goods enter inventories—counted as investment—so the accounts still balance. The identity describes the realized totals; it does not guarantee that everyone’s plans matched in advance.
We can separate national saving into two pieces. Let denote net taxes—taxes minus transfers—in this simplified notation. Private saving is income left to households after consumption and net taxes; public saving is the government’s net taxes minus its purchases:
A government budget deficit means public saving is negative. That can lower national saving, all else equal, but it does not mechanically tell us what private saving, interest rates, or investment will do. Households may change their saving, monetary policy may respond, and international capital can flow across borders.
When the economy trades with the rest of the world
For an open economy, include exports and imports :
Rearrange using :
With defined as GDP, this simplified account gives , where . If national saving is instead defined consistently using gross national disposable income—which adjusts GDP for net primary income and transfers from abroad—the full national-accounts relationship is , where is the current-account balance. The current account includes net exports as well as net primary income and secondary income, so it is not always exactly equal to .
A current-account deficit is not automatically evidence of a crisis or a mistake. It means a country’s investment and spending exceed its national saving under the accounting relationship, with net financing from abroad. Whether that is sustainable or beneficial depends on what the funds finance, future income, risk, currency arrangements, and the terms of the borrowing. The identity tells us where the financing comes from; it does not grade the decision.
A model of the real interest rate
Now move from accounting to a model of decisions. Imagine a market where savers are willing to supply funds and firms or households seek financing for projects. In a basic loanable-funds diagram, the vertical axis is the expected real interest rate, , and the horizontal axis is the quantity of funds. A higher real return can encourage some people to postpone consumption, so planned saving slopes upward in the simplified model. A higher real financing cost makes fewer investment projects worthwhile, so planned investment slopes downward.
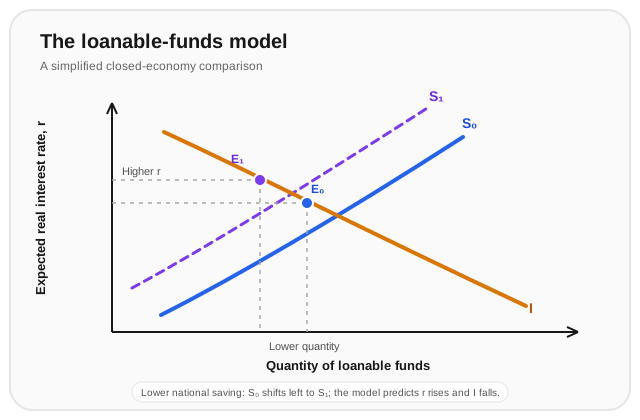
At the intersection, planned saving and planned investment are equal in this closed-economy model. If households become more patient, or public saving rises, the supply of funds may increase. If firms expect more profitable projects, investment demand may increase. A change in the equilibrium real rate helps coordinate those plans in the model.
The word real is important. A nominal interest rate is quoted in money terms; the expected real rate adjusts for expected inflation. For modest rates, the familiar approximation is
where is the nominal rate and is expected inflation. A business comparing a project’s expected real return with its real financing cost cares about purchasing power, not only the number of dollars repaid. In practice, loan rates also include risk, maturity, liquidity, and other premiums, so there is no single rate faced by every borrower.
What the diagram leaves out
The loanable-funds picture is a framework for reasoning, not a photograph of a modern financial system. Commercial banks can create a deposit when they make a loan; they do not simply hand a borrower a particular saver’s deposit. As the earlier lesson on money and banking explained, banks still face capital, liquidity, credit-risk, funding, settlement, and regulatory constraints. Deposit creation does not make lending unlimited or costless.
The model also compresses many markets into one interest rate and assumes a clean relationship between saving and the funds available for investment. Central-bank policy, banks’ balance sheets, credit standards, expectations, asset prices, and cross-border flows can all matter. In a more advanced model, we would distinguish short-term policy rates from longer-term yields, safe rates from risky borrowing rates, and domestic from foreign finance.
So why use the simple diagram at all? Because it makes a useful question visible: if the economy saves less, or firms suddenly see more profitable projects, what forces might bring plans back into balance? The answer is not always “the interest rate moves and nothing else changes.” The diagram gives us a disciplined starting point for asking what shifts, who adjusts, and what assumptions are doing the work.
Worked example
A closed economy has national income of 1,000 units, consumption of 650, government purchases of 200, and net taxes of 220. Calculate private, public, and national saving, then use the accounting identity to find investment. If instead the economy is open and investment is 180 while national saving remains 150, what does the simplified current-account identity imply?
Step 1 — calculate private saving. Households’ income after net taxes is . After consumption of 650, private saving is
Step 2 — calculate public saving. The government collects 220 in net taxes and purchases 200 of goods and services:
The budget has a surplus of 20 in this simplified example. National saving is the sum:
Step 3 — use the closed-economy identity. Because the economy is closed, . Investment is therefore 150 units. Check the expenditure identity: .
Step 4 — change the assumption to an open economy. If national saving is still 150 but investment is 180, then
The simplified current-account balance is a deficit of 30, so the economy receives net financing from abroad. This does not by itself tell us whether the investment is productive, whether the borrowing is safe, or how the deficit is distributed across sectors.
Where this leads
Saving and investment connect today’s choices about consumption and finance to the capital available for future production. They are a useful bridge between the introductory macroeconomic map and formal growth theory. The next step is to examine how capital accumulation interacts with labor, productivity, and technology—and why adding more capital alone cannot explain sustained growth forever.